After 15 years working at the intersection of climate science, geospatial analytics and machine learning, I’ve come to an uncomfortable conclusion:
We do not have a climate data shortage.
We have a climate communication failure.
We have more than 40 years of continuous global satellite time-series tracking vegetation, temperature and atmospheric change. In many regions, we have over a century of weather station records and in parts of the world, more than 150 years of instrumental observations feeding into global climate datasets. The evidence is unequivocal: global temperatures have risen by approximately 1.1°C since pre-industrial times, and the last decade has been the warmest on record. We can model regional futures at high resolution. We can simulate ecosystem responses. We can process planetary-scale environmental data in real time.
The signal is clear.
And yet — climate inaction persists.
Why?
Because most climate information is communicated as outputs, not as meaning. As maps, not as narratives. As uncertainty ranges, not as lived experience.
When Data Becomes Landscape
During my MSc research on vegetation change in Namaqualand, I analysed decades of satellite-derived NDVI and EVI data, modelling rain-use efficiency and quantifying shifts in productivity and seasonality. The results showed rising temperatures, highly variable rainfall, regional gains and losses in vegetation productivity, and subtle shifts from annual to perennial dominance.
The science was rigorous.
But something was missing.
When we paired the satellite time-series with repeat photographs, the abstraction became landscape.
At one site in the communal lands, vegetation cover remained largely stable between the 1950s and the 2000s. In a region often framed through narratives of degradation, that stability was significant. It challenged assumptions and grounded the satellite signal in lived reality.
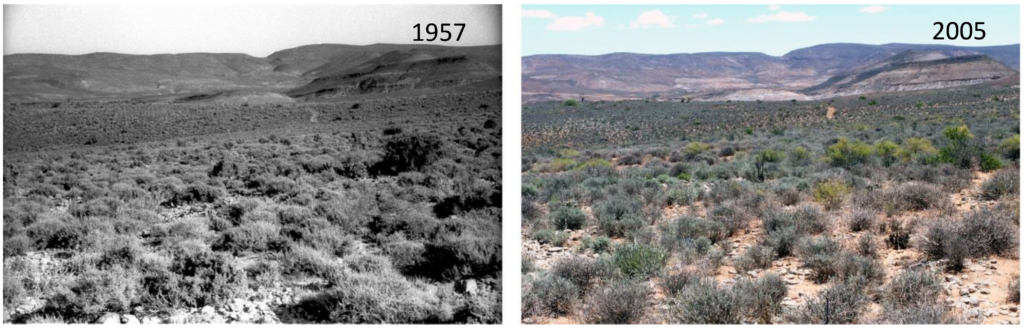
At another site on commercial land, the later photograph revealed a clear increase in vegetation cover, particularly woody thickening along a non-perennial river. What appeared in the satellite data as increased productivity was visible on the ground as expanding tree cover along riparian zones.

The graphs showed trends.
The photographs showed change.
The science did not change.
The framing did.
Scaling the Narrative Across a Continent
My PhD expanded this work to the scale of sub-Saharan Africa, using 34 years of satellite-derived vegetation data to detect long-term trends and abrupt shifts in productivity.
What emerged was not simply a pattern of greening and browning.
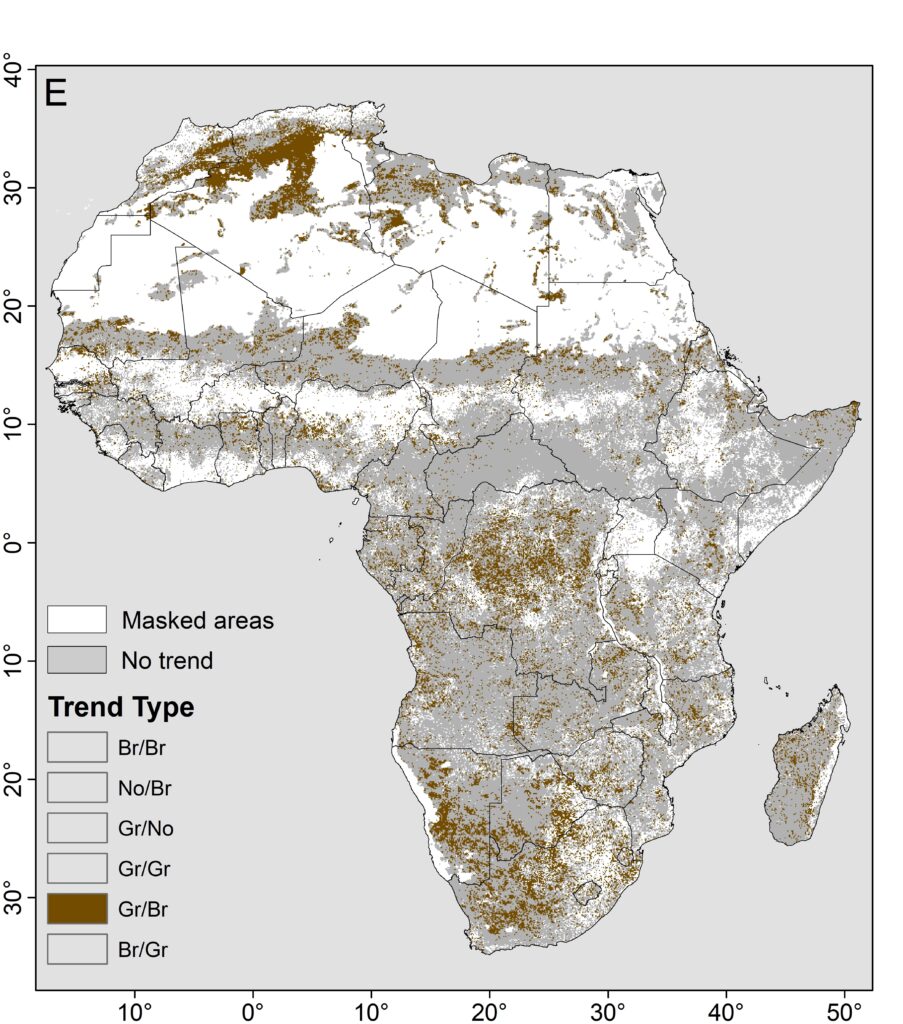
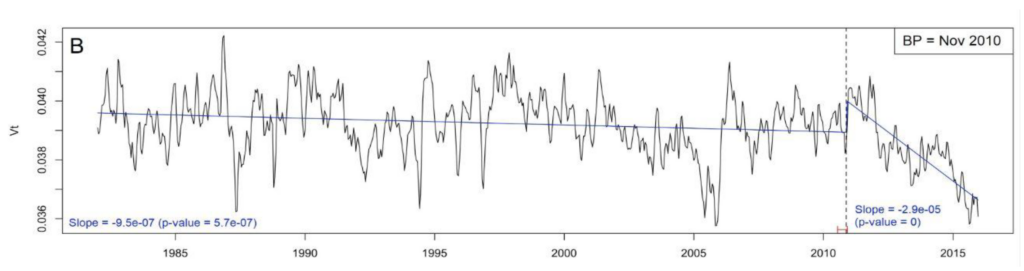
In several regions, particularly parts of Angola, Mozambique and Madagascar, vegetation productivity showed sustained declines that intensified in the latter part of the time series. The trend was not linear. It strengthened over time.
The map highlights where these persistent declines are occurring. The time-series panel shows the slope steepening in recent years. This is not just variability. It suggests amplification.
This is where climate storytelling becomes more difficult.
Because tipping behaviour does not announce itself politely. It emerges gradually, then accelerates. A continent does not shift uniformly. It fragments into hotspots of change.
Scientifically, identifying these potential tipping dynamics matters for model refinement and early warning. Strategically, it matters because decision-makers rarely respond to slow signals. They respond to visible turning points.
The challenge is communicating those turning points before they become irreversible.
Designing Climate Intelligence for Action
This lesson shaped my later work on applied climate platforms, including the National Climate Change Information System and the South African Risk and Vulnerability Atlas.
These systems integrate geospatial hazard modelling, machine learning and risk analytics. But their purpose is not computational sophistication. It is decision support.
A probabilistic flood map is not just a raster output. It is a story about exposure, inequality and infrastructure resilience. A vegetation productivity trend is not just a time-series. It is a signal about ecosystem services and long-term stability.
Climate science has matured enormously. We can model future scenarios with remarkable precision. Yet what determines whether this intelligence drives action is not additional complexity. It is clarity.
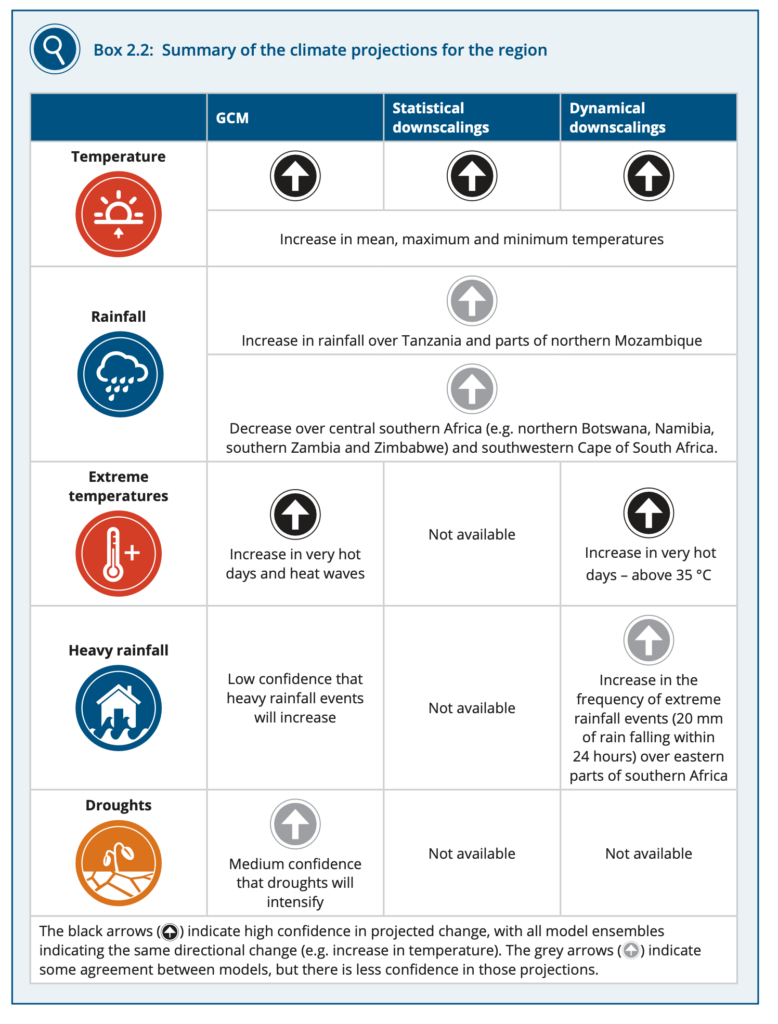
The IPCC-style summary of regional projections illustrates this well. Instead of overwhelming readers with ensemble spreads and statistical detail, it communicates direction of change and confidence in a structured, intuitive format. Temperature increases are unequivocal. Extreme heat intensifies. Drought risk rises. The science remains rigorous, but the message becomes usable.
This is disciplined synthesis.
Precision is essential. But precision without structure can paralyse. Decision-makers need directional signals, risk ranges and adaptive pathways.
Three Principles for Better Climate Storytelling
After years working across research, policy and applied AI systems, three principles stand out.
First: Anchor data in place.
Global warming is abstract. Local water stress is tangible. Connect climate trends to specific landscapes, sectors and communities.
Second: Pair quantitative analysis with visible change.
Satellite time-series gain power when paired with ground truth, historical imagery or lived experience. Abstraction must meet reality.
Third: Translate uncertainty into decisions.
Rather than asking, “How certain are we?” ask, “What choices remain robust across plausible futures?” Scenario framing is more powerful than probabilistic paralysis.
The AI Era Will Not Fix This Automatically
We are entering an era in which machine learning can detect early warning signals in vegetation health, predict hazard exposure at scale, and simulate adaptive pathways across sectors. Yet better algorithms will not automatically lead to better action. If anything, AI increases the volume and velocity of information, and without strong narrative framing, more data risks amplifying confusion rather than clarity.
From Analysis to Leadership
Climate change is not only an environmental crisis, it is a communication challenge. As scientists and data professionals, we are trained to analyse and model, but impact requires translation. The most powerful climate insight is not the most complex model; it is the moment someone sees their landscape, their business, or their community reflected in the data.
Climate change is not limited by a lack of evidence. It is limited by the gap between evidence and action. Closing that gap means treating storytelling as a core component of climate intelligence, not an afterthought.
In the climate era, leadership is not about having more data.
It is about making it matter.
References
Davis-Reddy, C.L. (2018) Assessing vegetation dynamics in response to climate variability and change across sub-Saharan Africa. PhD thesis, Stellenbosch University, South Africa.
Davis, C.L., Hoffman, M.T. and Roberts, W. (2017) ‘Long-term trends in vegetation phenology and productivity over Namaqualand using the GIMMS AVHRR NDVI3g data from 1982 to 2011’, South African Journal of Botany, 111, pp. 76–85.
Davis, C.L., Hoffman, M.T. and Roberts, W. (2016) ‘Recent trends in the climate of Namaqualand, a megadiverse arid region of South Africa’, South African Journal of Science, 112(3/4).
Davis-Reddy, C.L. and Vincent, K. (2017) Climate Risk and Vulnerability: A Handbook for Southern Africa. 2nd edn. Pretoria: Council for Scientific and Industrial Research.